There is a need for greater visibility, understanding, and flexibility of electricity demand to support the transition to low-carbon energy. The smart meter roll out in Great Britain presents new opportunities to address these three challenges for all energy consumers. For instance, dynamic pricing allow households to consume low-cost energy more during periods of high renewable output and provide flexibility as an alternative to expensive network reinforcements. Short-term forecasts of individual electricity demand will be essential to provide coordinate flexibility efficiently, especially with proliferation of electric vehicles, heating, and batteries [1].
Forecasting at low voltage levels can be challenging, and different to the conventional approach of demand forecasting at the transmission level. As electricity demand is aggregated, group behaviors become clear, as shown by the emergence of a smooth diurnal pattern in Figure 1, which tend to only change slowly and are therefore relatively predictable. Disaggregate demand is much more changeable and influenced by unknown behaviors and processes. This requires a new approach to forecasting, which should be developed with the end-use in mind.
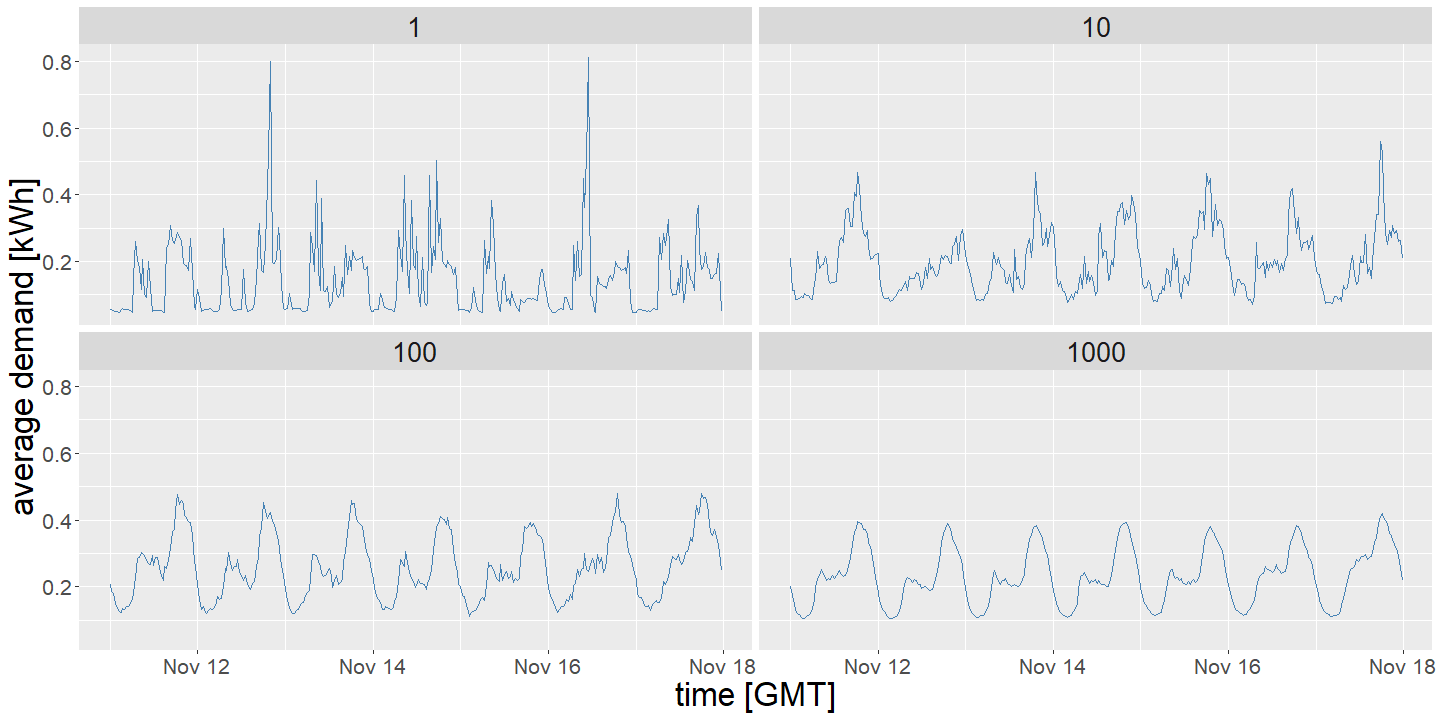
Figure 1. Average half-hourly demand for a collection of smart meters (SM), with the number of SMs indicated at the top of each panel, during a week in November 2013. As the number of smart meters increases the time series becomes smoother and more predictable.
Peak demand is typically the limiting factor in the capacity of distribution networks, set by the maximum power a cable of transformer can handle. Therefore, day-ahead forecasts of the peak demand could be useful from both utilities perspective (e.g. in setting dynamic prices), and the consumers perspective (e.g. for scheduling battery or EV charging).
Another aspect to consider is that electricity demand is hierarchical from the meter, feeder, secondary substation, primary substation level, and above. Respecting this reality in our forecasting models can help improve accuracy and enable more coordinated decisions at different levels of the network. A plot of the daily peak demand at the primary substation level is shown on Figure 2 for a hypothetical hierarchy constructed from the bottom-up, using smart meter data.
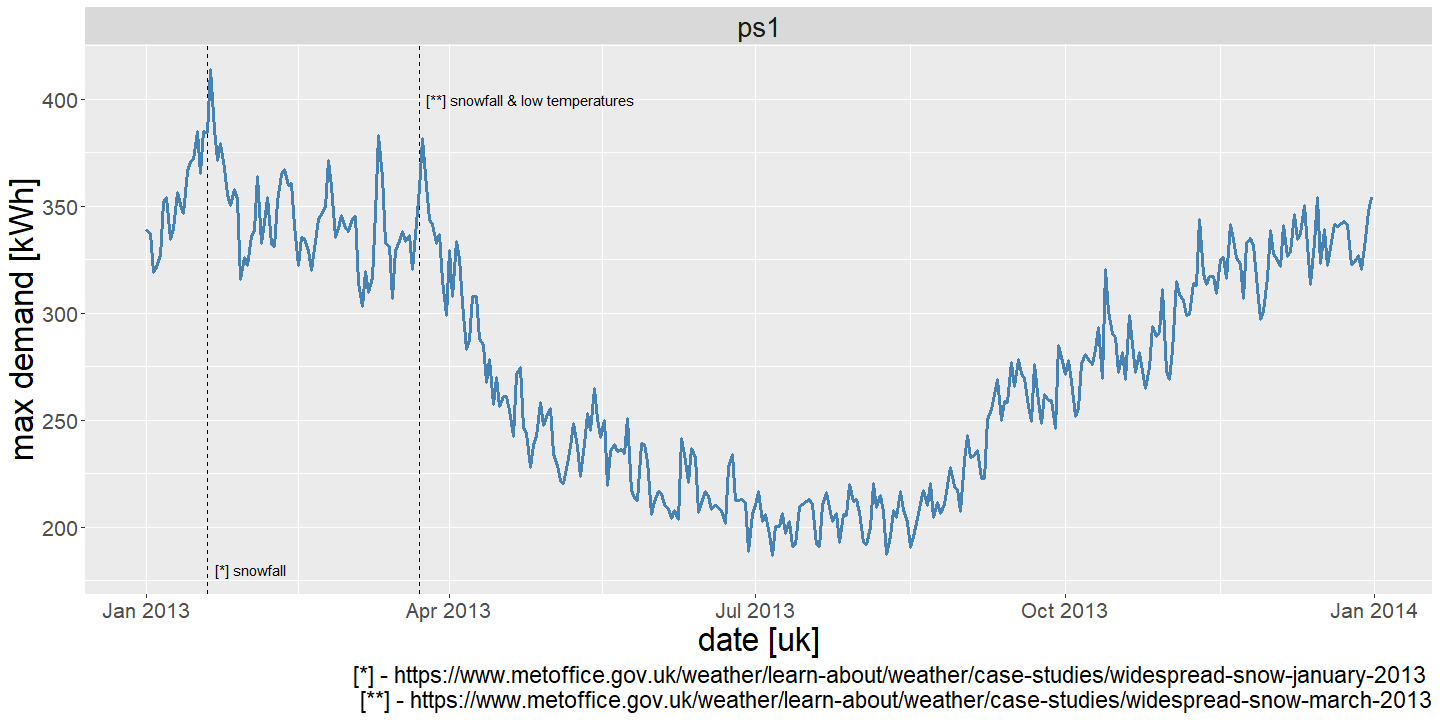
Figure 2. Daily peak demand for a hypothetical (& small!) primary substation constructed from aggregate smart meter data. At this level of aggregation there is seasonal, weekday, and temperature dependencies which help inform forecasting models.
Of course peak demand intensity is only one half of the problem; considering the time-of-peak is also very relevant. There is significant diversity in the time-of-peak characteristics at the smart meter level, driven by individual behaviours, as shown in Figure 3. Therefore, the goal of our research is to forecast bivariate quantities of daily peak intensity and timing at these different voltage levels, with a view to create coherent probabilistic forecasts of these quantities.
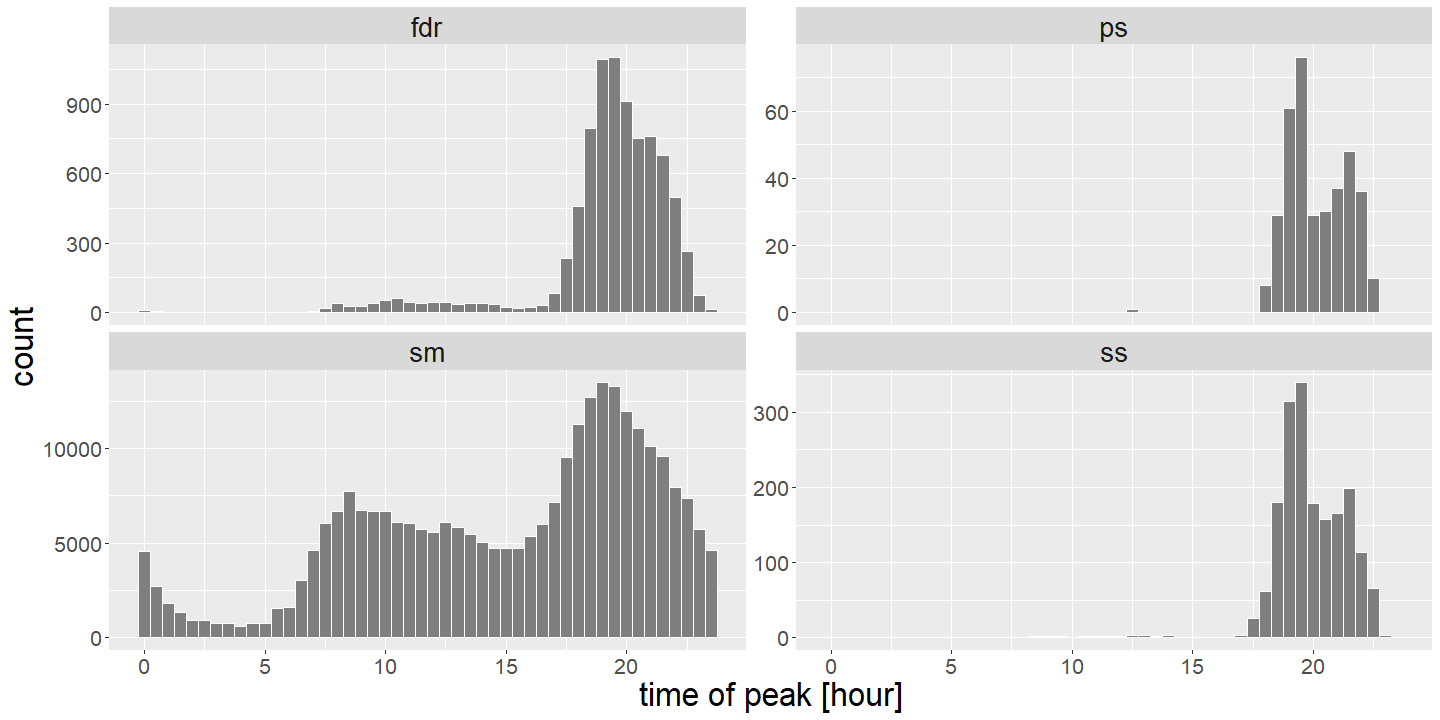
Figure 3. Histogram of the time-of-peak in a hypothetical hierarchy at the smart meter (sm), feeder (fdr), and substation (ss,ps) levels. At the SM level of aggregation the time-of-peak is spread over the full day, and as the aggregation level increases peaks become more concentrated in the evening.
Finally, there is no one-size-fits all approach to forecasting disaggregate demand, given the diversity of behaviours. To illustrate, Figure 4 shows the autocorrelation and partial autocorrelation function of the daily peak demand intensity for 4 smart meters. This suggests that using auto-regressive type models could be successful at some, and not at others. Thanks for reading!
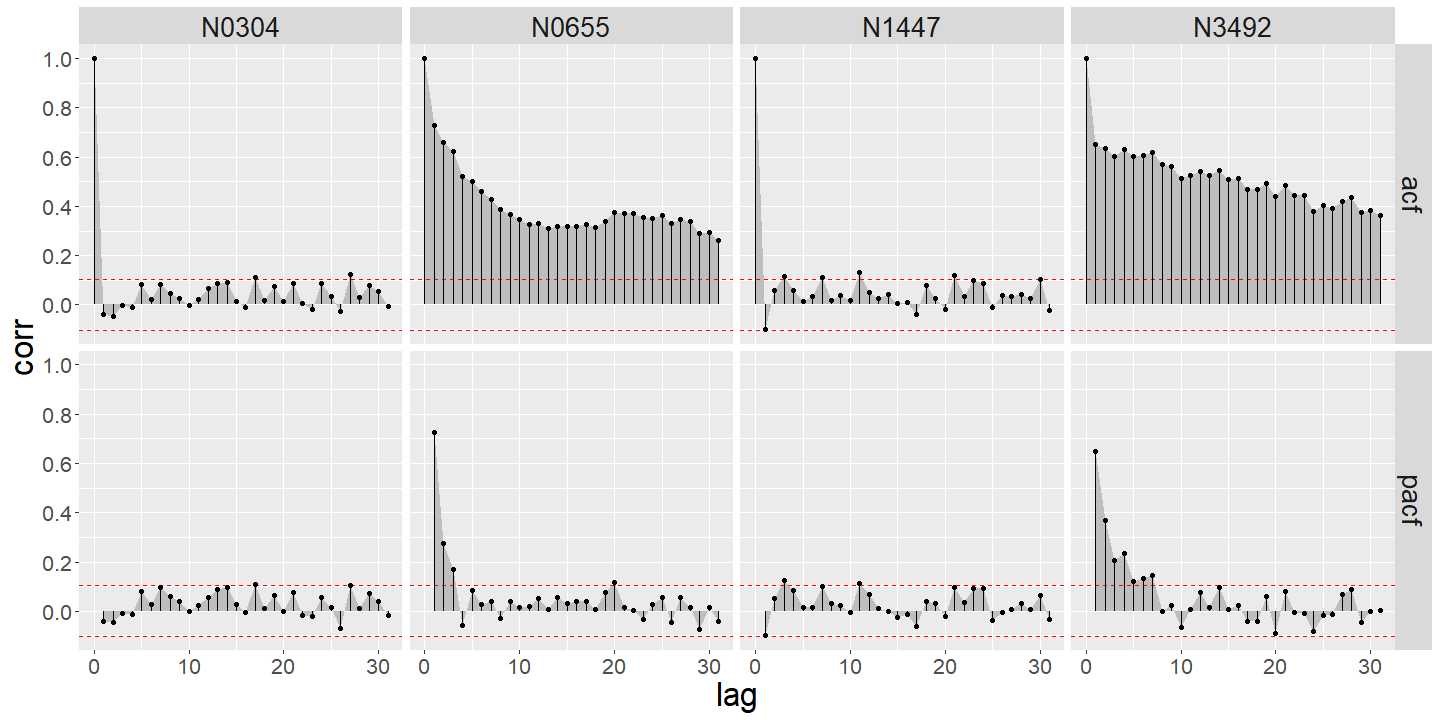
Figure 4. Autocorrelation (acf) and partial autocorrelation (pacf) plots of daily peak demand at 5 smart meters. There is a diversity of characteristics of the time series suggesting that different model formulations will work better at different meters, e.g. autoregressive type models could perform well at N0655, but not N0304. Clustering smart meters into similar groups will help address this problem.
[1] – https://arxiv.org/pdf/2005.10092.pdf
data source: http://doi.org/10.5255/UKDA-SN-7857-2